
文章导航
网人互联是小夜在2013年就发布过的国人vps主机商家,收到了商家发来的评测邮件;主要采用kvm为基础架构,支持windows和linux操作系统;数据中心分别是香港沙田和美国洛杉矶pr任选,小夜收到的是沙田的VPS测试,以下有详细内容。如果有兴趣测试shad0ws0cks,请在下面留下邮件,我会把测试的密码和IP发给您。
![]()
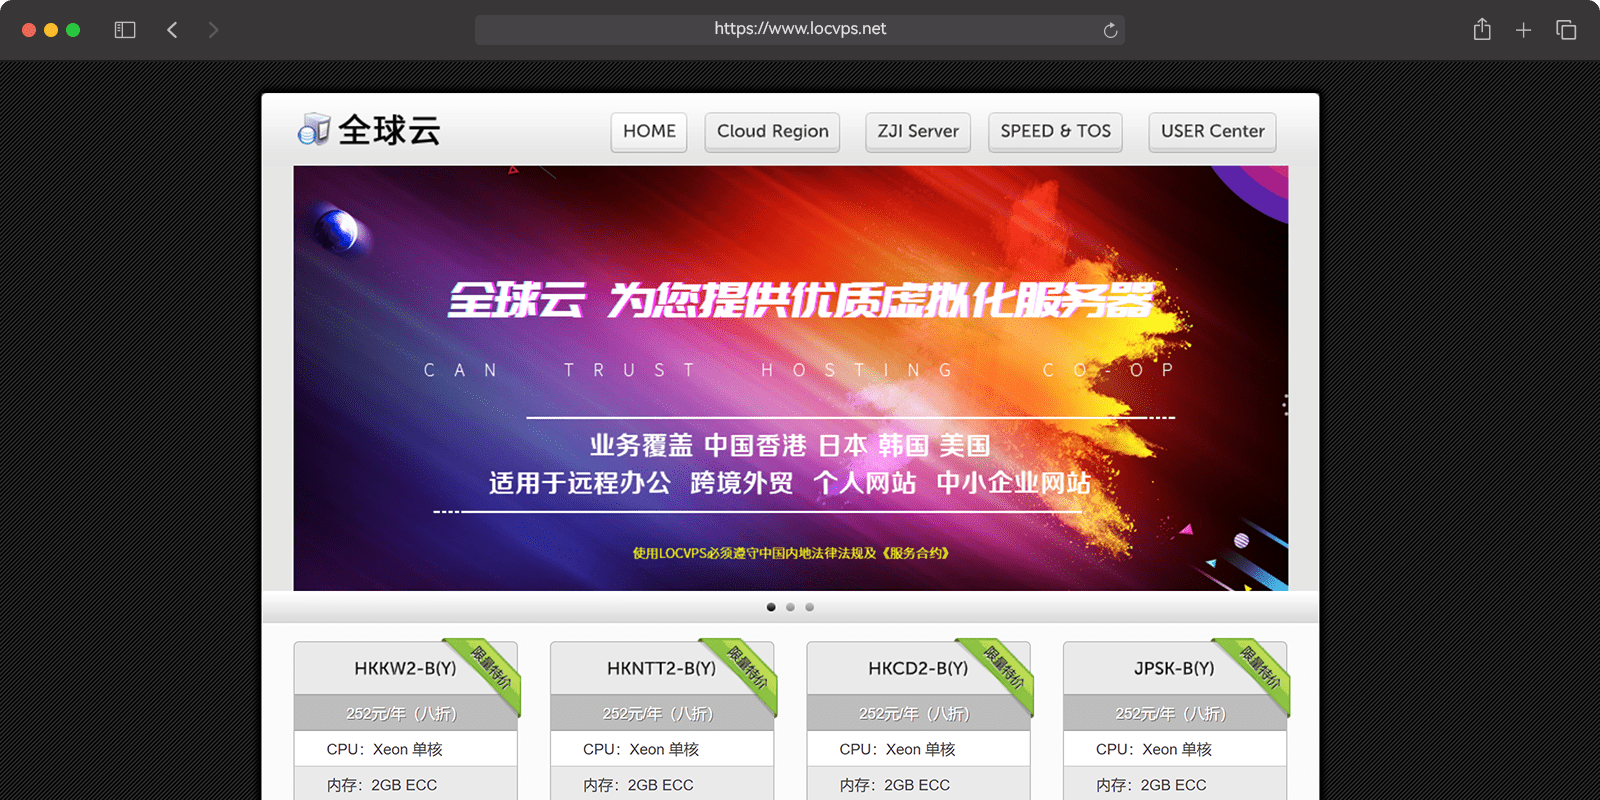
数据中心可美国,价格配置相同;可额外购买最多3个IP地址,每个15元/月。小夜下面的评测为香港沙田,硬件和性能方面,还是十分不错的,进行了科学上网功能完整性测试,正常的网站均可访问。
优惠方案
|
|
|
官网链接
![]()
测试IP
118.193.215.102 / php探针 / 10mb.test / wordpress演示
5had0ws0cks测试
Your Server IP:  118.193.215.102
Your Server Port:  5566
Your Password:  vpsr.com.cn
Your Local IP:  127.0.0.1
Your Local Port:  1080
Your Encryption Method:  aes-256-cfb
综合测试
root@san:/vpsmm# sh soft.vpsr.com.cn/bench.sh
CPU model :  QEMU Virtual CPU version 1.5.3
Number of cores : 2
CPU frequency :  2266.746 MHz
Total amount of ram : 994 MB
Total amount of swap : 1023 MB
System uptime :   43 min,
Download speed from CacheFly: 2.39MB/s
Download speed from Coloat, Atlanta GA: 546KB/s
Download speed from Softlayer, Dallas, TX: 1.89MB/s
Download speed from Linode, Tokyo, JP: 2.36MB/s
Download speed from i3d.net, Rotterdam, NL: 832KB/s
Download speed from Leaseweb, Haarlem, NL: 1.11MB/s
Download speed from Softlayer, Singapore: 2.33MB/s
Download speed from Softlayer, Seattle, WA: 1.32MB/s
Download speed from Softlayer, San Jose, CA: 2.14MB/s
Download speed from Softlayer, Washington, DC: 1.63MB/s
I/O speed :  320 MB/s
硬件测试
root@san:/vpsmm# free -m
             total       used       free     shared    buffers     cached
Mem:           994        558        436          0         11         51
-/+ buffers/cache:        495        499
Swap:         1023          0       1023
root@san:/vpsmm# uptime
 18:45:58 up  1:02,  2 users,  load average: 0.00, 0.04, 0.05
root@san:/vpsmm# df -hal Filesystem Size Used Avail Use% Mounted on /dev/vda1 39G 2.3G 35G 7% / proc 0 0 0 - /proc sysfs 0 0 0 - /sys none 4.0K 0 4.0K 0% /sys/fs/cgroup none 0 0 0 - /sys/fs/fuse/connections none 0 0 0 - /sys/kernel/debug none 0 0 0 - /sys/kernel/security udev 488M 4.0K 488M 1% /dev devpts 0 0 0 - /dev/pts tmpfs 100M 352K 100M 1% /run none 5.0M 0 5.0M 0% /run/lock none 498M 0 498M 0% /run/shm none 100M 0 100M 0% /run/user none 0 0 0 - /sys/fs/pstore systemd 0 0 0 - /sys/fs/cgroup/systemd
root@san:/vpsmm# lscpu
Architecture:          x86_64
CPU op-mode(s):        32-bit, 64-bit
Byte Order:            Little Endian
CPU(s):                2
On-line CPU(s) list:   0,1
Thread(s) per core:    1
Core(s) per socket:    1
Socket(s):             2
NUMA node(s):          1
Vendor ID:             GenuineIntel
CPU family:            6
Model:                 13
Stepping:              3
CPU MHz:               2266.746
BogoMIPS:              4533.49
Hypervisor vendor:     KVM
Virtualization type:   full
L1d cache:             32K
L1i cache:             32K
L2 cache:              4096K
NUMA node0 CPU(s):     0,1
网络测试
root@san:/vpsmm# wget cachefly.cachefly.net/100mb.test
--2016-01-09 19:01:15--  http://cachefly.cachefly.net/100mb.test
Resolving cachefly.cachefly.net (cachefly.cachefly.net)... 205.234.175.175
Connecting to cachefly.cachefly.net (cachefly.cachefly.net)|205.234.175.175|:80... connected.
HTTP request sent, awaiting response... 200 OK
Length: 104857600 (100M) [application/octet-stream]
Saving to: ‘100mb.test’
100%[==============================================>] 104,857,600 2.39MB/s   in 42s
2016-01-09 19:01:57 (2.39 MB/s) - ‘100mb.test’ saved [104857600/104857600]
#使用yunvm上海节点测试结果
root@debian:~# wget 118.193.215.102/10mb.test
--2016-01-10 03:00:28--  http://118.193.215.102/10mb.test
正在连接 118.193.215.102:80... 已连接。
已发出 HTTP 请求,正在等待回应... 200 OK
长度:10485760 (10M) [application/octet-stream]
正在保存至: “10mb.test”
100%[==============================================>] 10,485,760  1.17M/s 花时 7.6s
2016-01-10 03:00:35 (1.31 MB/s) - 已保存 “10mb.test” [10485760/10485760])
#使用阿里云北京节点测试结果
root@iZ254g98rvsZ:~# wget 118.193.215.102/10mb.test
--2016-01-09 19:08:10--  http://118.193.215.102/10mb.test
Connecting to 118.193.215.102:80... connected.
HTTP request sent, awaiting response... 200 OK
Length: 10485760 (10M) [application/octet-stream]
Saving to: ‘10mb.test’
100%[==============================================>] 10,485,760   446KB/s   in 23s
2016-01-09 19:08:33 (449 KB/s) - ‘10mb.test’ saved [10485760/10485760]
硬盘读写
root@san:/vpsmm# dd if=/dev/zero of=test bs=64k count=4k oflag=dsync
4096+0 records in
4096+0 records out
268435456 bytes (268 MB) copied, 7.13757 s, 37.6 MB/s
root@san:/vpsmm# dd if=/dev/zero of=test bs=64k count=4k oflag=dsync
4096+0 records in
4096+0 records out
268435456 bytes (268 MB) copied, 6.3688 s, 42.1 MB/s
root@san:/vpsmm# dd if=/dev/zero of=test bs=64k count=4k oflag=dsync
4096+0 records in
4096+0 records out
268435456 bytes (268 MB) copied, 6.76319 s, 39.7 MB/s
综合跑分
Benchmark Run: Sat Jan 09 2016 19:39:05 - 20:07:10
2 CPUs in system; running 2 parallel copies of tests

Dhrystone 2 using register variables       52161051.3 lps   (10.0 s, 7 samples)
Double-Precision Whetstone                     6301.5 MWIPS (9.0 s, 7 samples)
Execl Throughput                               5908.6 lps   (29.6 s, 2 samples)
File Copy 1024 bufsize 2000 maxblocks       1012313.8 KBps  (30.0 s, 2 samples)
File Copy 256 bufsize 500 maxblocks          275172.5 KBps  (30.0 s, 2 samples)
File Copy 4096 bufsize 8000 maxblocks       2398692.4 KBps  (30.0 s, 2 samples)
Pipe Throughput                             3372429.9 lps   (10.0 s, 7 samples)
Pipe-based Context Switching                 484101.5 lps   (10.0 s, 7 samples)
Process Creation                              13682.8 lps   (30.0 s, 2 samples)
Shell Scripts (1 concurrent)                   8291.7 lpm   (60.0 s, 2 samples)
Shell Scripts (8 concurrent)                   1471.1 lpm   (60.0 s, 2 samples)
System Call Overhead                        4952220.6 lps   (10.0 s, 7 samples)

System Benchmarks Index Values               BASELINE       RESULT    INDEX
Dhrystone 2 using register variables         116700.0   52161051.3   4469.7
Double-Precision Whetstone                       55.0       6301.5   1145.7
Execl Throughput                                 43.0       5908.6   1374.1
File Copy 1024 bufsize 2000 maxblocks          3960.0    1012313.8   2556.3
File Copy 256 bufsize 500 maxblocks            1655.0     275172.5   1662.7
File Copy 4096 bufsize 8000 maxblocks          5800.0    2398692.4   4135.7
Pipe Throughput                               12440.0    3372429.9   2711.0
Pipe-based Context Switching                   4000.0     484101.5   1210.3
Process Creation                                126.0      13682.8   1085.9
Shell Scripts (1 concurrent)                     42.4       8291.7   1955.6
Shell Scripts (8 concurrent)                      6.0       1471.1   2451.8
System Call Overhead                          15000.0    4952220.6   3301.5
                                                                   ========
System Benchmarks Index Score                                        2090.7
测试IP
118.193.215.102 / php探针 / 10mb.test / wordpress演示
站长站测试
- 线路最快节点最慢节点平均响应
- 所有
香港[海外]最快<1毫秒
荷兰[海外]最慢390毫秒
67毫秒
- 电信
香港1毫秒
内蒙古364毫秒
51毫秒
- 多线
香港4毫秒
山东115毫秒
43毫秒
- 联通
广东深圳33毫秒
陕西西安113毫秒
53毫秒
- 移动
广东深圳12毫秒
山东69毫秒
42毫秒
- 海外
香港<1毫秒
荷兰390毫秒
148毫秒
路由追踪
                               My traceroute  [v0.75]
debian (0.0.0.0)                                               Sun Jan 10 02:17:59 2016
Resolver: Received error response 2. (server failure)er of fields   quit
                                               Packets               Pings
 Host                                        Loss%   Snt   Last   Avg  Best  Wrst StDev
 1. 203.156.218.1                             0.0%    30    1.7   2.3   1.0   5.1   1.0
 2. 218.78.187.65                             0.0%    30    0.5   1.0   0.5   8.2   1.5
 3. 218.78.187.90                             0.0%    30    2.2   3.4   2.1  13.0   2.5
 4. 101.95.223.29                             0.0%    30    1.0   1.2   1.0   3.3   0.5
 5. 101.95.225.53                            86.2%    29    1.9   7.7   1.9  24.5  11.2
 6. 101.95.207.65                            10.7%    29    4.3   5.9   1.8  26.1   7.2
 7. 61.152.86.2                               0.0%    29    7.7   4.8   2.4   7.7   1.1
 8. 59.43.80.9                                6.9%    29    2.2   2.8   2.1   8.7   1.5
 9. 59.43.17.214                              0.0%    29    2.2   2.5   2.2   6.3   0.7
10. 59.43.91.102                             13.8%    29    3.1   3.4   2.7   5.8   0.8
11. 59.43.246.214                             0.0%    29    3.4   7.8   3.2  72.6  13.2
12. 59.43.183.78                             13.8%    29  118.3  39.4  29.7 118.3  24.1
13. 59.43.248.194                             0.0%    29   29.6  34.5  29.5  77.2  11.4
14. 202.55.1.98                               0.0%    29   31.7  32.0  31.4  37.9   1.2
15. 118.193.215.102 0.0% 29 35.1 34.0 32.5 43.9 2.3 


评论 (13)